Chapter 17: Business Analysis Interview Questions and Answers (Part-3)
What is Sequence Diagram/Interaction Diagram ? Explain.
Sequence diagrams are used to illustrate how different parts of the system interact with each other to carry out a function, and order in which interactions occur when a particular use case is executed.
Sequence Diagram Notations
Lifeline Notation
A sequence diagram is made up of several lifeline notations that should be arranged horizontally across the top of the diagram.

Activation Bars
Activation bar is the box placed on the lifeline. It is used to indicate that an object is active (or instantiated) during an interaction between two objects. The length of the rectangle indicates the duration of the objects staying active.
In a sequence diagram, an interaction between two objects occurs when one object sends a message to another. The use of the activation bar on the lifelines of the Message Caller (object that sends the message) and the Message Receiver (object that receives the message) indicates that both are active and instantiated during the exchange of the message.

Message Arrows
An arrow from the Message Caller to the Message Receiver specifies a message in a sequence diagram. A message can flow in any direction; from left to right, right to left or back to the Message Caller itself. While you can describe the message being sent from one object to the other on the arrow, with different arrowheads you can indicate the type of message being sent or received.
Synchronous message:-
A synchronous message is used when the sender waits for the receiver to process the message and return before carrying on with another message. The arrow head used to indicate this type of message is a solid one, like the one below.

Asynchronous message:-
An asynchronous message is used when the message caller does not wait for the receiver to process the message and return before sending other messages to other objects within the system. The arrow head used to show this type of message is a line arrow like shown in the example below.

Return message:-
A return message is used to indicate that the message receiver is done processing the message and is returning control over to the message caller. Return messages are optional notation pieces, for an activation bar that is triggered by a synchronous message always implies a return message.

Participant creation message:-
Objects do not necessarily live for the entire duration of the sequence of events. Objects or participants can be created according to the message that is being sent.
The dropped participant box notation can be used when you need to show that the particular participant did not exist until the create call was sent. If the created participant does something immediately after its creation, you should add an activation box right below the participant box.

Participant destruction message:-
When participant is no longer needed can be deleted from a sequence diagram. This is done by adding an ‘X’ at the end of the lifeline of the said participant.

Reflexive message:-
When an object sends a message to itself, it is called a reflexive message. It is indicated with a message arrow that starts and ends at the same lifeline like shown in the example below.

Comment
UML diagrams generally permit the annotation of comments in all UML diagram types. The comment object is a rectangle with a folded-over corner as shown below. The comment can be linked to the related object with a dashed line.

Purpose of the Sequence/ Interaction Diagram
- To describe the structural organization of the objects.
- To describe the interaction among objects.
- To capture the dynamic behavior of a system.
- To describe the message flow in the system.
Example: Sequence/Interaction Diagram for ATM transaction using Invalid PIN

What is State Transition Diagram/State Chart Diagram? Explain.
State transition diagram is a diagram used to describe the behavior of the system using finite number of states. It represents behavior of the object in response to external stimuli / to series of events in a system.
State Transition Diagram/State Chart Diagram Notations
State
States represent situations during the life of an Sate is represented using a rectangle with rounded corners.

Transition
A solid arrow represents the path between different states of an object. Label the transition with the event that triggered it and the action that results from it. A state can have a transition that points back to itself.

Initial State
A filled circle followed by an arrow represents the object's initial state.

Final State
An arrow pointing to a filled circle nested inside another circle represents the object's final state.

Synchronization of Control
A short heavy bar with two transitions entering it represents a synchronization of control. It is called a join, where the concurrent transitions reduce back to one.

Splitting of Control
Splitting of control is called a fork where a single transition splits into concurrent multiple transitions.

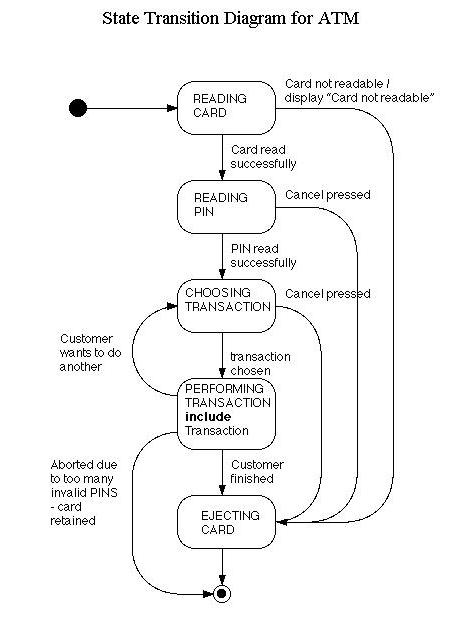
Example: State Transition Diagram for ATM
What is Use Case Diagram/Behavior Diagram
A use case is a list of actions or event steps typically defining the interactions between a actor (role) and a system to achieve a goal. The actor can be a human or other external system.
Use Case diagrams are used in requirement gathering and analysis.
Use Case Diagram Notations
System
Draw your system's boundaries using a rectangle that contains use cases. Place actors outside the system's boundaries.

Use Case
Draw use cases using ovals. Label the ovals with verbs that represent the system's functions.

Actors
Actors are the users of a system. When one system is the actor of another system, label the actor system with the actor stereotype.

Relationships
Illustrate relationships between an actor and a use case with a simple line. For relationships among use cases, use arrows labeled either "uses" or "extends."
Include/Uses
A "uses" relationship indicates that one use case is needed by another in order to perform a task.

Extends
An "extends" relationship indicates alternative options under a certain use case.

Example: Use Case Diagram for ATM


